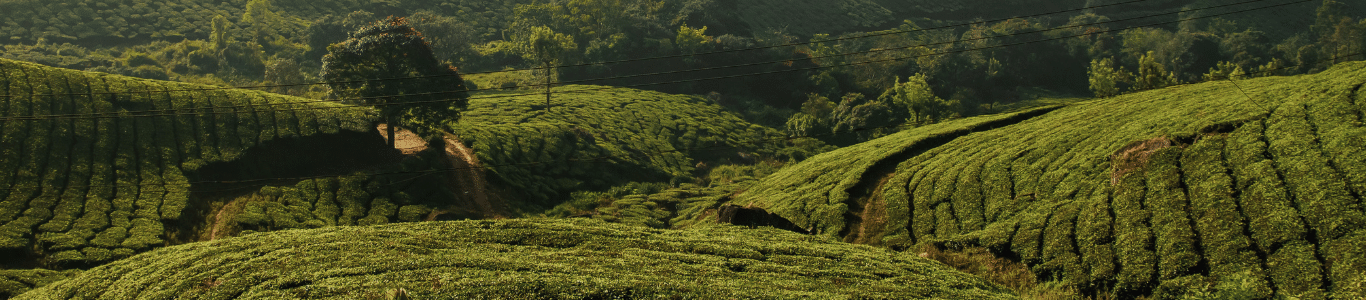
Improve grassland fertilization
System: Dairy Cattle
Applicability
Mainly applicable for: Pasture-based systems
Not applicable or effective for: Non-grassland systems
Description
Optimizing the rate, timing, source and placement of nitrogen (N) fertilizer to increase herbage yield and nutritional value, while simultaneously reducing N losses by matching N inputs with grass growth. The optimal N rate is site-specific depending on local climate and soil conditions, and stocking rate. Depending on the current situation, optimization can imply either a reduction or increase of N application rates (in high vs. low fertilized grasslands).
Grassland is fertilized on a per-cut basis or on a number of occasions during the grazing season. The optimal fertilizer rate per application event depends on the target yield for that cut or desired herbage mass for grazing, which varies across periods within the growing season and determines both the marginal N response and the N content of the herbage. To optimize N use efficiency and prevent mineralized N from becoming available after the growing season, fertilizer should not be applied late in the season (the exact cutoff date depends on the location).
Application equipment should be properly managed and maintained to ensure accurate fertilizer application. Other nutrients, such as phosphorus (P) and potassium (K), should also be optimized to ensure efficient production and minimize GHG emissions. For information about effects of liming in arable crop systems, see factsheet ‘Lime soils when required’.
Mechanism of effect
The optimum fertilization rate is influenced by the fact that there is decreasing marginal N response: adding nitrogen to N-limited grassland will lead to large yield increases, whereas at higher N application rates each additional kg of N fertilizer produces a progressively smaller increase in grass yield. The mechanism behind the effect on GHG emissions thus depends on the current situation:
- In currently high N-fertilized grassland, reducing the N fertilizer rate can lead to a reduction in herbage DM yield and digestibility, with a stronger decrease in the N content of grass. Total GHG emissions may slightly increase due to a need for additional purchased feed and somewhat lower digestibility, but this can be compensated by the reduction in nitrous oxide emissions due to less fertilizer application and a lower N excretion, and lower emissions from the production of the (synthetic or organic) fertilizers.
- At currently low N fertilization rates, increasing N inputs can have a relatively large effect on improving herbage yields and nutritional quality. This will reduce the need for additional feed imports, reduce enteric methane emissions due to improved digestibilty, and potentially increase milk yield due to higher nutritional quality and feed intake. Since there is a risk of greater nitrous oxide emissions from soils, the farm level GHG benefits of increasing N fertilizer rates should be balanced against increased nitrous oxide emissions.
Nitrogen fertilization also contributes to soil organic carbon (SOC), because increased plant growth enhances below-ground biomass and the release of organic compounds from living roots (‘exudation’). Organic fertilizer is particularly effective because of the large amount of easily decomposable C stimulating microbial growth, which can stabilize SOC.
Effects on GHG emissions
Reference situation: Sub-optimal N fertilization rate
Effect on total greenhouse gas (GHG) emissions
| Mean effect and range in kg CO2-equivalents | per kg product | per farm (absolute) | Level of evidence | ||
| Mean | (min-max) | Mean | (min-max) | ||
| Optimize nitrogen fertilization rate | ●● | ●–●● | ●● | ●–●● | High |
Legend
| ● – Small effect (<5%) | o – No effect | ? – Effect unknown |
| ●● – Medium effect (5-20%) | ● – Unfavourable effect | |
| ●●● – Large effect (>20%) | ● – ● – Variable effect (depending on farm characteristics or way/level of implementation) | |
Effect per emission source
| Mean effect on absolute emission from | Animal | Manure storage | Feed and forage production | Barn | |||
| CH4 | CH4 | N2O | CO2 | N2O | LUC | CO2 | |
| Optimize nitrogen fertilization rate | ?* | ?* | ●●● | ?* | ?* | ||
*risk of an adverse effect (see ’cause of variable or unfavourable effect’)
Legend
| ● – Small effect (<5%) | o – No effect | ? – Effect unknown |
| ●● – Medium effect (5-20%) | ● – Unfavourable effect | |
| ●●● – Large effect (>20%) | ● – ● – Variable effect (depending on farm characteristics or way/level of implementation) | |
Effect on soil organic carbon (SOC) stocks
| Relative change (%) in SOC%: | ||||
| Mean | (min-max) | Level of evidence | ||
| N fertilization vs. no N fertilization | ● ● | ●– ●● | High | |
| Organic fertilizer vs. no fertilizer or synthetic fertilizer | ●●● | ●– ●●● | High | |
Legend
| ● – small increase (<10%) | ● – small decrease (<5%) | o – no effect |
| ●● – medium increase (10-25%) | ●●– large decrease (≥5%) | ? – Effect unknown |
| ●●● – large increase (>25%) | ● – ● – Variable effect (depending on farm characteristics or way/level of implementation) |
Cause of variable or unfavourable effect
Optimize N fertilization rate
The optimum N fertilizer rate differs per site and depends on various aspects such as grass N requirements per cut, rotation (N left in soil), soil type (soil N supply), weather conditions (rainfall and temperature), fertilizer type (synthetic, organic, legume) and application methods (e.g. spreading, injection). The direction of effects on emissions depends on the N fertilizer rate in the reference situation and new situation (see mechanism of effect). The size of effect will depend on the room for improvement: amount of N fertilizer reduced, or improvement in grass yields and nutritional quality. The effects also depend on the type (emission factor) of the N fertilizer that is increased or reduced, the type (emission factor) of purchased feed or forage that is increased or reduced, and final feed ration quality.
N fertilization vs. no N fertilization
The effect of N fertilization on SOC depends on the plant species composition of grassland. For example, a smaller effect can be expected for legumes, as legumes show less biomass growth under high N fertilization rates (while contributing more to SOC than grass under a zero N fertilization regime). The effect also depends on the N fertilization rate: optimal N fertilizer rates enhance vegetation growth, which in turn enhances biomass and the release of organic compounds from living roots (‘exudation’), contributing to SOC.
Organic fertilizer vs. no fertilizer or synthetic fertilizer
The effect on SOC depends on the rotation (perennial vs. annual cover); type of organic fertilizer (organic fertilizer with large amount of easily decomposable C stimulate microbial growth, which can stabilize SOC); fertilizer quality (organic fertilizers with low C:N ratio are decomposed faster); fertilization rate (optimal N fertilizer rates enhance crop growth which enhance biomass and exudates contribution to the soil); climate (smaller SOC increase in warm and dry conditions) and soil texture (higher SOC increase in fine-textured soils).
Other Effects
Effects on yield and cost-effectiveness
| Yield | Labor | Costs and revenues | ||||
|---|---|---|---|---|---|---|
| Animals | Crops | Time | Capital investment | Operational Costs | Revenues | |
| Optimize N fertilization rate | o-●● | o-●● | ●-o | ●–● | ● | ●–●● |
| Organic fertilizer (vs. no or synthetic fertilizer) | ●●–●● | ●–●● | ●-o | ●–● | ●–●● | o-●● |
Legend (thresholds differ per indictor and can be found in the tooltip)
| ● – Small favorable effect | o – No effect | ? – Effect unknown |
| ●● – Medium favorable effect | ● – Unfavourable effect | |
| ●●● – Large favorable effect | ● – ● -Variable effect (depending on farm characteristics or way/level of implementation) | |
Effects on other sustainability aspects
| Risks of trade-offs | Potential synergies | |
|---|---|---|
| Optimize N fertilization rate | Ammonia emission, Water use, Water quality, Soil health, Biodiversity, Public health | |
| Organic fertilizer (vs. no or synthetic fertilizer) | Ammonia emission, Water quality, Societal and cultural acceptance | Water use, Water quality, Soil health, Biodiversity |
| Literature references | Optimize N fertilization rate |
|---|---|
| Warner et al., 2016 | Effects of nitrogen fertilisation rate and maturity of grass silage on methane emission by lactating dairy cows |
| Bannink et al., 2009 | Simulating the effects of grassland management and grass ensiling on methane emission from lactating cows |
| Velthof et al., 1996 | Effects of type and amount of applied nitrogen fertilizer on nitrous oxide fluxes from intensively managed grassland |
| Bell et al., 2016 | Quantifying N2O emissions from intensive grassland production: the role of synthetic fertilizer type, application rate, timing and nitrification inhibitors |
| IPCC, 2006 | 2006 IPCC Guidelines for National Greenhouse Gas Inventories.Chapter 11: N2O Emissions from Managed Soils, and CO2 Emissions from Lime and Urea Application. |
| Hauggaard-Nielsen et al., 2016 | Productivity and carbon footprint of perennial grass–forage legume intercropping strategies with high or low nitrogen fertilizer input |
| Yan et al., 2013 | Life cycle assessment of milk production from commercial dairy farms: The influence of management tactics |
| Sorley et al., 2024 | Factors influencing the carbon footprint of milk production on dairy farms with different feeding strategies in western Europe |
| Bannink et al., 2016 | Quantifying effects of grassland management on enteric methane emission |
| Hospers et al., 2022 | The evolution of the carbon footprint of Dutch raw milk production between 1990 and 2019 |
| Schils et al., 2022 | Permanent grasslands in Europe: Land use change and intensification decrease their multifunctionality |
| Shi et al., 2024 | A global meta-analysis on the effects of organic and inorganic fertilization on grasslands and croplands |
| Vellinga et al., 2010 | Implementation of GHG mitigation on intensive dairy farms: Farmers’ preferences and variation in cost effectiveness |
| Van den Pol-Dasselaar et al., 2013 | Kosteneffectiviteit reductiemaatregelen emissie broeikasgassen zuivel |
| Literature references | N fertilization vs. no N fertilization |
| Eze et al. 2018 | Soil organic carbon stock in grasslands: Effects of inorganic fertilizers, liming and grazing in different climate settings |
| Beillouin et al., 2023 | A globalmeta-analysis of soil organic carbon in the Anthropocene |
| Conant et al., 2017 | Grassland management impacts on soil carbon stocks: a new synthesis |
| Literature references | Organic fertilizer vs. no fertilizer or synthetic fertilizer |
| Shi et al., 2024 | A global meta-analysis on the effects of organic and inorganic fertilization on grasslands and croplands |
| Beillouin et al., 2023 | A global meta-analysis of soil organic carbon in the Anthropocene |